A New Standard for Blood Sugar Control: Why Time in Range (TIR) Is More Accurate Than HbA1c Alone
Continuous glucose monitoring (CGM) has rewritten the rules of health management. According to the latest 2026 diabetes care standards, keeping blood sugar within 70 to 180 mg/dL for at least 70% of the time (TIR) effectively reduces the risk of complications. This is roughly equivalent to an HbA1c of about 7%. And even if you have not fully hit that target, any improvement in this number translates to better health outcomes.
Su-Yun is sixty-one, a retired kindergarten teacher of thirty years. She was diagnosed with diabetes five years ago and has been a model patient ever since: taking medication on time, attending regular appointments, and pricking her finger every morning for a fasting glucose reading. Her numbers usually fell between 110 and 130, and she felt her control was pretty good.
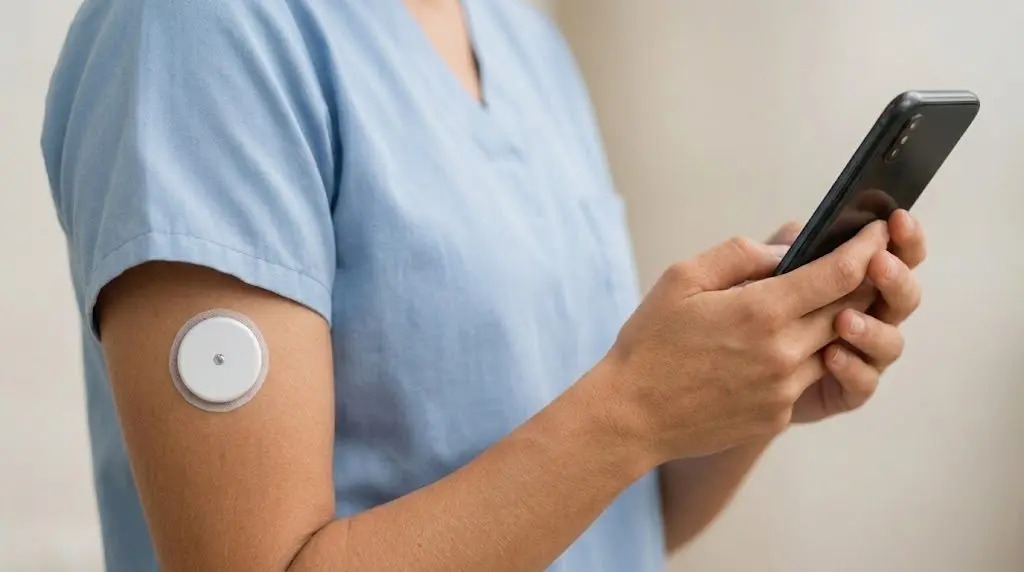
At last month's appointment, her doctor suggested she try continuous glucose monitoring -- wearing a coin-sized sensor patch on her arm for two weeks, then coming back to review the data. Su-Yun found it novel and even snapped a photo for her girlfriends' group chat. They all asked if she had put on some kind of new pain-relief patch.
Two weeks later, she was stunned by the report.
Instead of her familiar single number, she was looking at a full page of colorful curves -- time on the horizontal axis, glucose on the vertical, with green, yellow, and red zones in between. The curve rose and dipped wildly, like a heartbeat tracing gone haywire. The report also featured several English abbreviations she had never seen: TIR, TAR, TBR, each followed by a percentage.
"My morning readings are always stable. How does this graph look like a roller coaster?" she asked, pointing at a spike to 220 at three in the morning.
This is actually a very common reaction the first time someone sees a CGM report. We are accustomed to seeing a single fasting glucose number and have no idea that while we sleep, eat, and walk, blood sugar is constantly fluctuating. This report is a complete diary your body has written for you. Once you crack a few key codes, you will have health information that is more timely and more precise than HbA1c alone.
Why Your Report Shows a Red Flag
To make sense of these wild curves and red flags, let us set aside the medical jargon and use two everyday images.
Dash Cam vs. Speed Camera
Traditional finger-stick glucose testing is like a roadside speed camera. You only know your speed at the exact instant you pass it. If you happened to hit the brakes right before the camera, the photo looks safe -- but that does not mean you drove steadily the entire trip.
The Ambulatory Glucose Profile (AGP) from a CGM is your body's dash cam. It records the entire journey, capturing every moment of your driving behavior.
When the report lights up red, it means that during this stretch of road, your speed was wildly inconsistent. Maybe after a big meal your speed shot up to 200 (blood sugar spike); when you went too long without eating, it dropped to 50 (hypoglycemia). A traditional speed camera (HbA1c) cannot capture these events, but the dash cam (CGM) sees everything.
The red flags are the system warning you: "You slammed the brakes here" and "You were speeding there."
Highway Lane Departure
Imagine your blood vessels are a highway. The medically defined target range (70-180 mg/dL) is the "safe lane."
As long as your car stays steadily within this lane -- drifting slightly left or right is fine -- you are safe. This is what the report calls "Time in Range (TIR)."
When the numbers flash red, your car has crossed the lines.
If it is "Time Above Range (TAR)," it is like swerving into the median barrier. This scrapes the car body, and over time the car (blood vessels) sustains damage.
If it is "Time Below Range (TBR)," the situation is more dangerous -- the car has gone off the outer guardrail toward a cliff.
The red light is warning you that your car has been hitting barriers too often or nearly plunging off the edge. You need to adjust how you grip the steering wheel and bring the car back to the center of the lane.
What Does the Research Say?
The medical standard for blood sugar management has undergone a complete overhaul. According to authoritative publications, we now care more about the "process" than a single result. Here are several key findings to help you read your body's data.
The 70% Golden Rule
We used to focus solely on HbA1c. Now the American Diabetes Association (ADA) recommends a more intuitive metric: Time in Range (TIR).
This is the percentage of the 24-hour day that your blood sugar stays within the "safe lane" (70-180 mg/dL). Research has found that this number directly corresponds to your long-term health risk.
As long as your TIR exceeds 70%, your body is in a state roughly equivalent to an HbA1c of around 7%. This is the health benchmark most people are striving for. Reaching this standard significantly lowers the risk of diabetic complications such as retinopathy and kidney disease.
You might ask: "What if I can't reach 70%?" Do not be discouraged. The latest clinical evidence shows that any improvement in this number is beneficial. Even going from 40% to 50%, as long as hypoglycemia episodes have not increased, represents a clinically significant health gain. Every small step forward means a little less burden on the body.
Two Danger Zones You Must Not Ignore
Before looking at the target range, physicians are actually more focused on two other numbers that represent immediate risk.
The first is Time Below Range (TBR) -- the time spent below 70 mg/dL, or even below 54 mg/dL. This represents hypoglycemia.
This is extremely dangerous. When adjusting medications or diet, the top priority is minimizing this number. Research recommends using this data to fine-tune insulin doses and avoid dangerous episodes.
The second is Time Above Range (TAR) -- time spent above 180 mg/dL or even above 250 mg/dL. This represents hyperglycemic risk.
While it will not cause you to faint on the spot like hypoglycemia can, over time it acts like a slow poison eroding blood vessels.
These two metrics help us evaluate hypoglycemic and hyperglycemic risk respectively, serving as the navigation chart for adjusting treatment plans.
How Long Do You Need Data For?
When you get the report, you might wonder: "Doctor, I only wore it for three days -- is that accurate enough?"
According to standard recommendations, interpreting a CGM report requires 10 to 14 days of data. During that period, the device must be worn at least 70% of the time.
Our lives change daily. Weekday work stress, weekend dinners out -- glucose patterns differ. Looking at just two or three days of data is like watching only the movie trailer and trying to write a review. It can easily lead to misinterpretation.
Fourteen days of data provide enough information for the AGP to draw your true daily glucose pattern, allowing your doctor to identify which time periods are your highest-risk windows.
The GMI Misconception
Your report may also display a number called GMI (Glucose Management Indicator). Many people treat it as a direct stand-in for HbA1c.
However, the latest research perspective recommends a shift in thinking. While GMI is a useful reference, for clinical decision-making, looking directly at the Mean Glucose is actually more important.
This is because GMI is a formula-derived estimate, and red blood cell lifespan varies between individuals, creating discrepancies between the calculated number and the lab-drawn HbA1c. Rather than agonizing over why the two numbers do not match, focusing on your mean glucose gives a more authentic picture of your current status.
Do I Need Further Action?
Feeling overwhelmed by all the numbers? Use this table for a quick assessment.
TIR above 70% (Honor student -- stable blood sugar, roughly equivalent to A1c around 7%): Keep up your current diet and exercise habits. No major adjustments needed. For: General diabetes patients, health screening participants. Follow-up: Every 6 months to 1 year.
TIR 50% to 70% (Borderline passing -- more than half the time in range): Identify the time of day when glucose "leaves the lane" (often after a specific meal) and adjust that meal's content. For: Those just beginning glucose management. Follow-up: 3 months.
TIR below 50% (Red alert -- most of the time glucose is unstable): Physician intervention needed. Medication dosing may be off, or there may be a major structural issue with diet. For: Those with poor control, medication users. Follow-up: Return within 1 month.
TBR above 4% (Danger -- hypoglycemia occurring too frequently): Top priority. Return immediately to discuss reducing medication or insulin dosage. Always carry glucose. For: All CGM users. Follow-up: Immediate.
Coefficient of variation (%CV) above 36% (Roller coaster -- large swings between highs and lows): Even if the average looks normal, excessive variability is harmful. Regularize daily routines. For: Those with irregular eating or chaotic schedules. Follow-up: 3 months.
Are There Side Effects or Risks?
CGM itself is a monitoring tool, not a medication -- it does not cause nausea, dizziness, or other physiological side effects. It is a sensor that adheres to the skin, detecting glucose in subcutaneous interstitial fluid through an extremely fine, flexible filament.
The biggest risk with this technology is actually misinterpretation.
The ADA specifically emphasizes that both patients and physicians need education to use this tool correctly. If you see a high reading and impulsively increase your medication, or see a low reading and binge-eat, you could create danger rather than prevent it.
Additionally, while the device's data are advanced, they have limitations. Report accuracy depends on wearing the device consistently. If wear time falls below 70%, or if the sensor site is compressed (such as sleeping on the arm), false alarms can occur.
For instance, sleeping on the sensor arm at night may produce "false hypoglycemia" readings. Eating in a panic based on those numbers without verification could trigger subsequent hyperglycemia.
The right mindset is to treat CGM as an aid, not the sole judge. When you see an unusual reading, first think about what you just did. When necessary, confirm with a traditional fingerstick.
What Should You Do? A Doctor's Recommendations
Since the goal is keeping blood sugar within 70-180 mg/dL (TIR above 70%), we need to focus on the fine details of daily life. This does not require a radical overhaul -- small adjustments can produce visible results.
Find Your "Weak Spot"
Look at your AGP chart and find the time of day with the highest peak. It is usually after a particular meal. Think back: what did you eat?
Was it that bowl of braised pork rice? Or the drink after the meal?
The approach is "fine-tuning." If you discover that eating a Chinese cruller with a sesame flatbread for breakfast sends glucose soaring to 250, try eating only half the flatbread next time, paired with unsweetened soy milk and an egg. Check the next day's curve, and you will see the peak has dropped.
This is where CGM is most valuable: it shows you food's true face.
Increase Green Time, Reduce Red Time
The goal is clear: increase the green zone (TIR) and shrink the red zones (TAR and TBR).
If your report shows frequent hypoglycemia (high TBR), address that first. It typically occurs before meals or in the middle of the night. Do not intentionally skip meals or fast for weight loss.
A stable eating frequency eliminates these dangerous valleys.
Once hypoglycemia is resolved, tackle the highs. A 15-minute walk after meals is a proven technique -- it works like an iron, pressing down that post-meal peak and bringing numbers back into the green zone faster.
Learn to Converse with Your Data
Do not expect a perfect score on the first try. The ADA notes that as long as your TIR number is trending upward, you are making meaningful progress.
Maybe you start at 50% and next month reach 55%. That is a victory. It means your blood vessels are under pressure for more than an hour less each day. Approach different food combinations with curiosity, watch the curves change, and you will find that managing blood sugar is more like playing a game of self-discovery than serving a prison sentence.
Common Misconceptions Clarified
Myth: I want to keep my blood sugar as low as possible -- that's healthiest, right?
Truth: Blood sugar that is too low is more dangerous than blood sugar that is too high. If TBR is too high on your report, you are at risk for hypoglycemia, which can lead to loss of consciousness or cardiovascular events. The goal is stability -- staying within 70 to 180 -- and absolutely avoiding drops below 70.
Myth: My GMI shows 6.5%, so my lab HbA1c must be 6.5% too?
Truth: These two numbers frequently do not match. GMI is an estimate calculated from the monitoring period's glucose data, while HbA1c is influenced by red blood cell lifespan. Some people's red blood cells live longer, pushing A1c higher. Rather than fixating on the gap between the two, look at Mean Glucose and TIR on the CGM report for a more accurate picture of your recent control.
Myth: As long as I wear this device, I don't need to watch my diet anymore?
Truth: This device is a "mirror," not a "vacuum cleaner." It reflects your true situation but does not suck away the glucose. You need to look at what the mirror shows and adjust what, when, and how much you eat. The device's value lies in real-time feedback: "This bowl of noodles hits you hard," so next time you know which landmines to avoid.
Final Thoughts
Feeling anxious about red flags on a health report is only human. But these red flags are your body sending out a distress signal.
Through continuous glucose monitoring, we can finally understand the body's language. That 70% target rate is the safe distance you and your body have agreed upon. You do not need to chase perfection. Just make the curve a little steadier each day, a little farther from the dangerous extremes, and you are building a health savings account for the future.
Pick up your report and look at your TIR number. If it is 60%, let us set 65% as the next goal. At your next visit, let us see whether the curve has become a little more beautiful.
Key Takeaways
TIR of 70% is the golden rule: Keeping blood sugar within 70-180 mg/dL for 70% of the time is roughly equivalent to an HbA1c around 7% and effectively lowers complication risk.
Hypoglycemia is more dangerous than hyperglycemia: TBR (Time Below Range) is the priority metric to address, as it can lead to loss of consciousness or cardiovascular events. When adjusting medications, always resolve this issue first.
Data need 10 to 14 days to be reliable: CGM reports require sufficient time to accumulate data that truly reflects daily glucose patterns, avoiding misinterpretation from short-term readings.